The Role of Dashboards in Prop Firm Success: Features to Look for in 2026
The Role of Dashboards in Prop Firm Success: Features to Look for in 2026

Introduction
In 2026, dashboards are not cosmetic add-ons. They are core infrastructure.
After industry consolidation in 2025, firms that scaled successfully were those that gave both internal teams and traders real-time visibility into exposure, performance, compliance, and payouts. When data is delayed or unclear, enforcement slows down, support volume rises, and confidence drops.
Firms upgrading from outdated portals to structured, real-time dashboards report measurable improvements in funded trader continuity, lower repetitive support volume, and faster enforcement processing. Poor dashboards, by contrast, create confusion — unclear drawdown tracking, delayed breach alerts, and constant “where do I stand?” tickets.
This guide explains why dashboards matter in 2026, which features serious firms now require, what to avoid, and how PropBrix by TradeBrix delivers unified oversight for operators and clarity for traders.
Why Dashboards Are Operational Infrastructure
Traders compare your interface to broker platforms. Expectations are high.
Admins need immediate visibility across hundreds or thousands of active accounts. Exposure distribution, drawdown proximity, and breach events must be visible instantly — not buried in spreadsheets.
Growth decisions also depend on clean data. Pass rates, time-to-breach patterns, payout velocity, and marketing source performance all rely on accessible reporting.
- 30–50% faster breach identification and enforcement processing
- 20–40% stronger funded trader continuity compared to legacy portals
- 15–35% reduction in repetitive support tickets
- Cleaner marketing optimization through clear source-to-performance tracking
Dashboards do not change risk models. They improve visibility and execution.
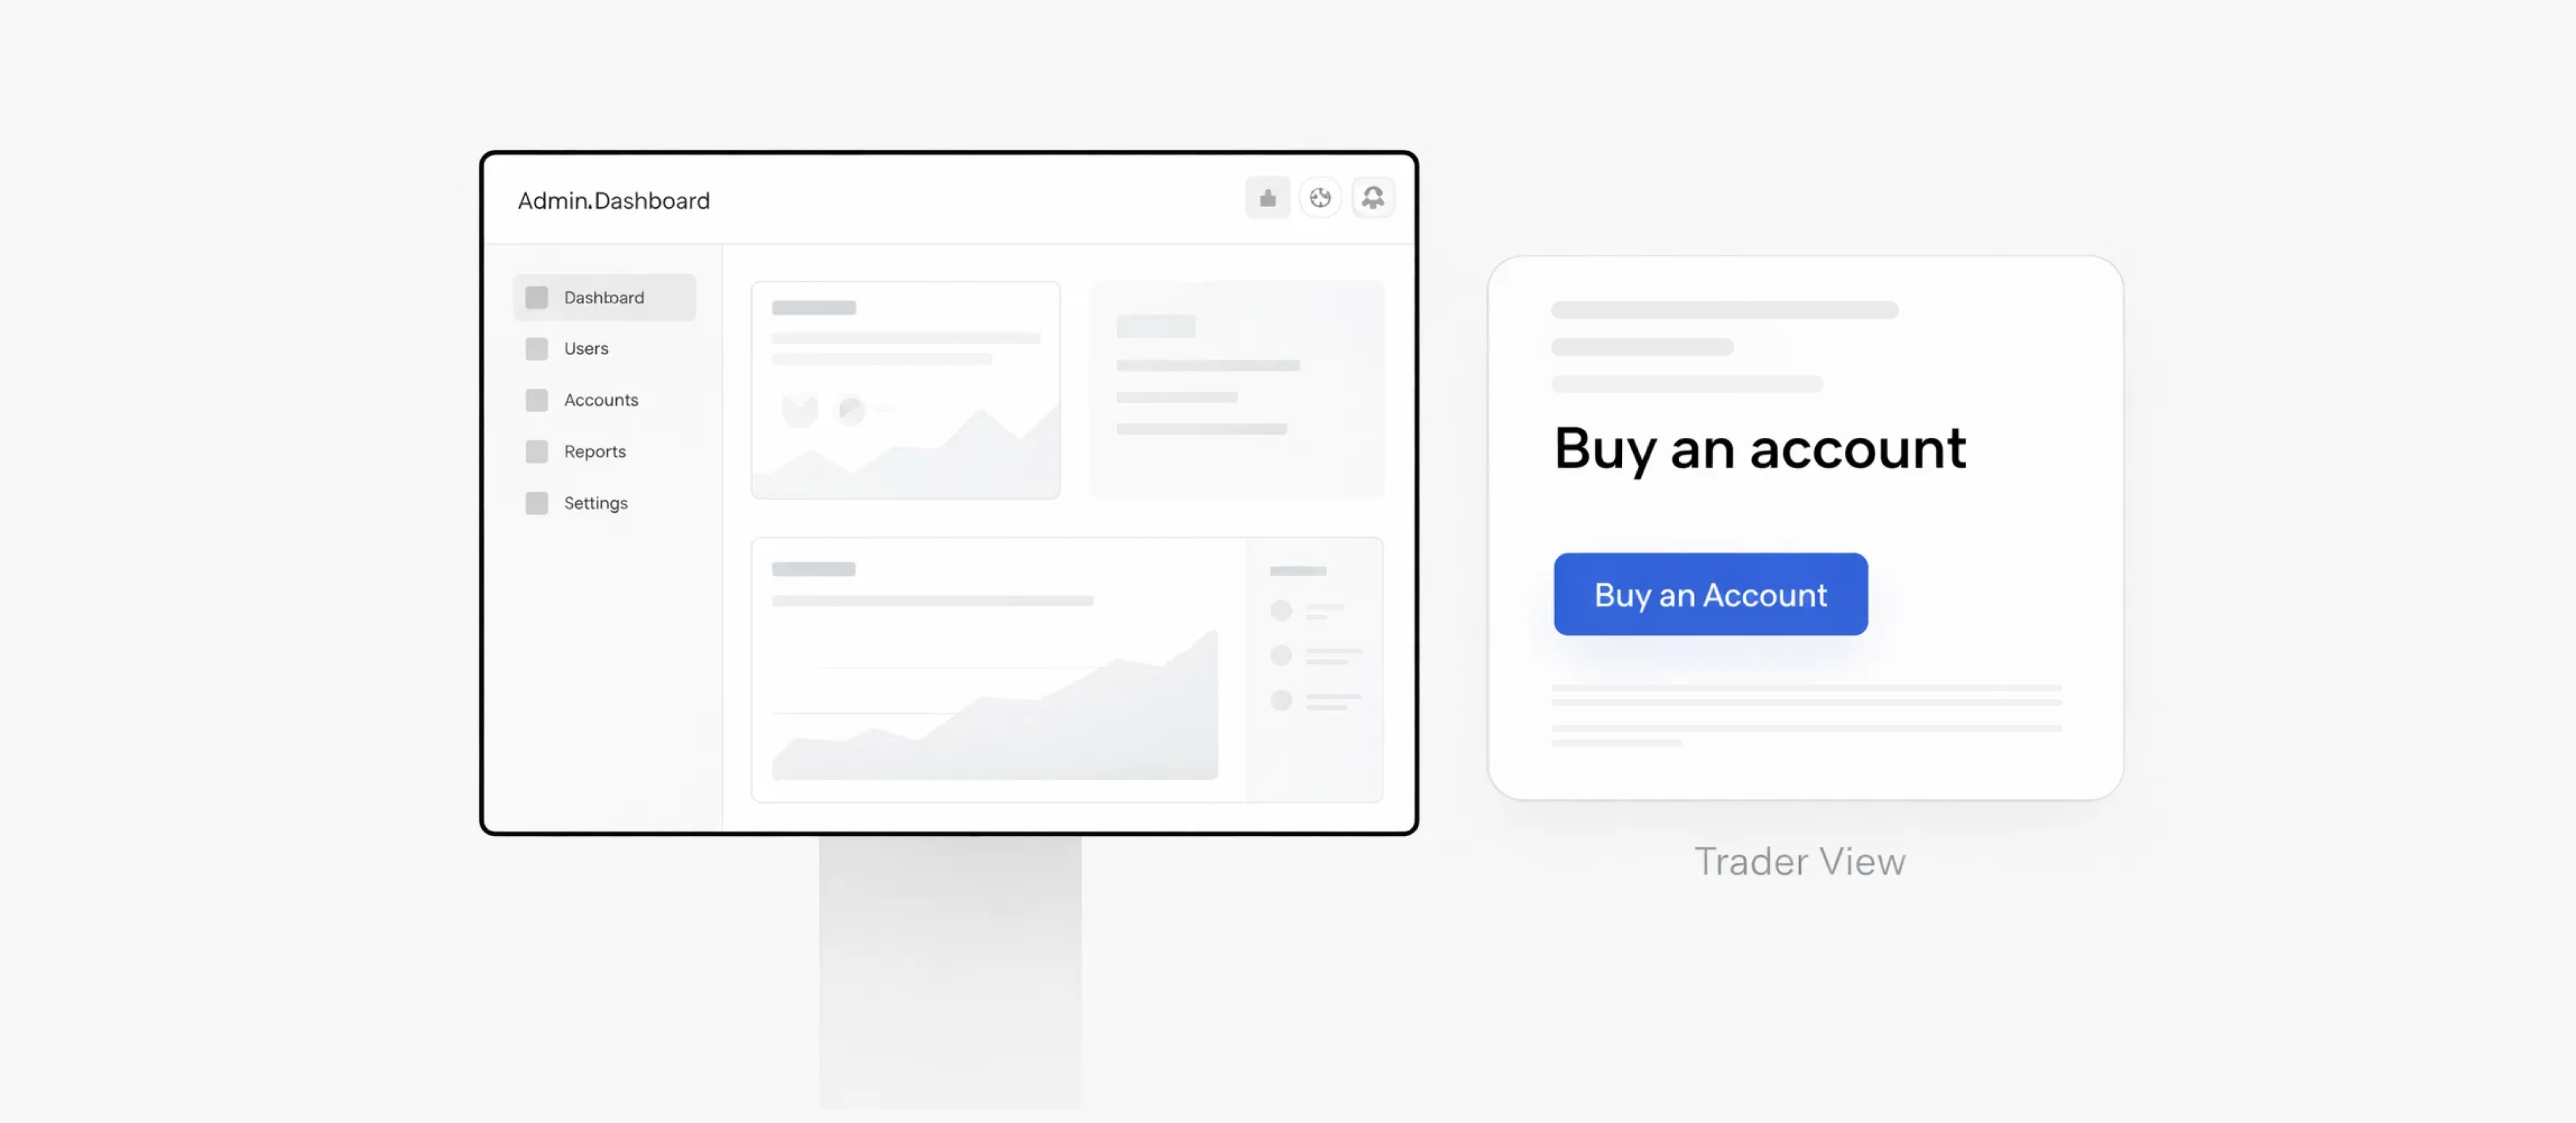
Essential Admin Dashboard Capabilities in 2026
For operators, the dashboard must surface what requires action immediately.
- Real-time overview of active traders and funded accounts
- Firm-wide exposure heat map showing drawdown distribution
- Live breach and alert feed with direct drill-down
- Pass rate analytics segmented by challenge type
- Time-to-breach distribution insights
- Marketing source tracking tied to challenge outcomes
- Compliance snapshot including KYC status and audit logs
- Structured payout queue with approval visibility
- Custom alert configuration (email, SMS, webhook)
The goal is not to show more numbers. It is to surface the metrics that actually require attention.
Essential Trader Dashboard Capabilities
Traders do not want decoration. They want clarity.
- Clear equity curve
- Visible daily and maximum drawdown gauges
- Exact distance to profit target
- Transparent breach explanations
- Trade history filters
- Progress tracking toward scaling milestones
- Payout history and next payout schedule
- Referral earnings tracker
- Fully responsive mobile interface
When traders can clearly see their limits and progress, support tickets drop. Confidence increases. Friction decreases.
Must-Have vs Advanced Features in 2026
| Feature Category | Must-Have Standard | Advanced Layer | PropBrix Status |
|---|---|---|---|
| Real-Time Risk Monitoring | Live drawdown & breach alerts | Predictive anomaly flags | Full |
| Trader Progress Visibility | Profit target & limit tracking | AI performance insights | Full |
| Admin Exposure Overview | Firm-wide heat map | Correlation overlays | Full |
| Marketing Attribution | Source → pass rate tracking | Predictive LTV modeling | Full |
| Payout Management | Structured queue & history | Automated reporting tools | Full |
| Mobile Experience | Fully responsive UI | Native app layer | Full |
| Customization | Role-based views | White-label branding | Full |
| Performance Speed | Instant load at scale | High-volume resilience | Full |
Dashboards in 2026 must load instantly, handle scale without lag, and present different views for risk, support, and finance teams.
What to Avoid in Modern Dashboards
- Static dashboards with delayed refresh cycles.
- Interfaces overloaded with charts but lacking drill-down capability.
- Manual reconciliation between separate systems.
- Poor mobile responsiveness when the majority of traders monitor performance on phones.
- Missing audit logs or export tools that complicate compliance review.
As trader volume grows, the dashboard should reduce complexity — not add to it.
How PropBrix Dashboards Are Structured for Scale
PropBrix by TradeBrix gives operators a live view of firm-wide risk while giving traders complete clarity on their rules, limits, and progress — all inside one unified system.
Real-Time Visibility
Exposure, breach alerts, and performance updates refresh instantly. Enforcement decisions are not delayed by batch processing.
Unified Risk and Growth Data
- Exposure heat maps
- Live breach alerts
- Pass rate analytics
- Marketing funnel performance
All inside the same environment used for trader management.
Clear Trader Interface
- Exact drawdown levels
- Profit target progress
- Structured rule explanations
- Transparent payout timelines
When traders know exactly where they stand, confusion drops and support workload decreases.
Structured Reporting
Compliance logs, payout summaries, and investor-ready metrics are exportable directly from the dashboard.
Built for Volume
The system maintains responsiveness even at high trader counts. As volume increases, the interface remains stable.
Implementation Best Practices
- Roll out admin and trader views together.
- Test mobile experience thoroughly before scaling traffic.
- Use real-time communication protocols rather than delayed data refresh.
- Train support teams fully so they can guide traders confidently.
- Ensure every enforcement action is audit-logged automatically.
As challenge models evolve, the dashboard should adapt without requiring major system rebuilds.
Conclusion
In 2026, dashboards turn trading activity into clear, usable information for both your team and your traders.
PropBrix by TradeBrix delivers real-time oversight, structured visibility, and scalable infrastructure so you can manage risk and growth from one environment.
Book a demo with TradeBrix to explore both admin and trader dashboards in action.
Featured resources

Introducing Our Rewards System: Powering the Next Phase of Prop Firm Growth
Discover how TradeBrix’s new Rewards Points System helps prop firms increase conversions, improve retention, and scale sustainably without relying on heavy discounts.

How to Start a Prop Firm in 2026: Step-by-Step Guide with Tech Essentials
Step-by-step 2026 guide to launching a prop firm: market opportunity, business models, compliance, technology stack, challenges, marketing, payouts, and scaling with TradeBrix.

The Role of Dashboards in Prop Firm Success: Features to Look for in 2026
Discover why prop firm dashboards matter in 2026, key admin and trader features to look for, and how PropBrix by TradeBrix delivers real-time risk visibility at scale.

Legal Compliance for Prop Firms in 2026: Navigating Regulatory Reality Without Slowing Growth
2026 guide to prop firm compliance: KYC/AML, marketing rules, jurisdiction choices, payout transparency, and how PropBrix by TradeBrix simplifies compliance at scale.